The Stereo Spectrum Analyzer enables you to
see your
Music spectrum for test purposes, for analysis purposes, or just for
entertainment. The Spectrum
Analyzer Software taps into the output Digital Audio Data stream to show you graphically the
spectral content of what you are hearing from your system.
The Spectrum Analyzer can be operated in Logarithmic or Linear Frequency axis Mode, Logarithmic or Linear Magnitude axis mode, or Music Mode. The Spectrum Analyzer can operate showing the Full Frequency Band, the Subsonic Frequency Band, or a Selected Frequency Band. In addition the Spectrum Analyzer can
be operated to display the Average, the Peak, or the Instantaneous Spectrum of the Music
data.
The magnitude Center and Range can be adjusted in order to view Music with low spectral energy content or
with high spectral energy content. The Spectrum analyzer uses Fast Fourier
Transform (FFT) techniques to generate the displayed spectrum graphs. The
Block Size of the algorithm can be adjusted to provide high resolution spectrum
graphs that update slowly or low resolution spectrum graphs that update quickly.
The Spectrum Analyzer can display Music spectrums in many graph modes such as
Left Plus Right, Left Minus Right, Left Only, Right Only, Left On Right, and
Dual Trace. The Spectrum Analyzer can operate in Persist Mode where successive
spectrum graphs are not erased but are drawn on top of each other.
The Spectrum Analyzer
Trigger Level, Trigger Delay, and Trigger Slope are adjustable to provide stable
viewing of almost any spectrum. The Spectrum Analyzer can trigger on the left or
the right channel in the Dual Trace modes.
The Spectrum Analyzer has a
front end compensation filter that can be enabled or disabled. The filter has a
characteristic that emphasizes certain frequencies to produce a more interesting
output when viewing music. This compensation should of course be disabled when
performing calibrations.
The Spectrum Analyzer screen
is fully integrated into the main screen display so that normal Stereo
Workstation activities can continue without interference.
Similar to the Oscilloscope, the non-technical person
will not have to know anything about Spectrums, Gains, FFTs, or Logarithms because the default
settings of Music Mode are designed to provide interesting visual displays for someone that just wants
to watch.
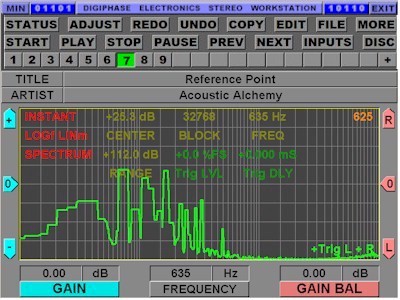
The following image shows a screen shot of a typical Music Spectrum waveform:

This picture shows
the Stereo Workstation Main Screen in Spectrum Analyzer
mode with Logarithmic Frequency axis and Linear Magnitude axis selected. This picture also shows that Instantaneous Mode and Left Plus Right Mode are selected. |